Realize a reporting
Web Reporting is a module of SphinxOnline allowing the creation, in a simple and intuitive way, of a diffusion platform for a given survey.

You can configure this platform to provide users with the following actions:
- Enter answers
- Consult all answers (sheets, spreadsheet)
- Display results and analyzes (dashboards, basic sorting tables, cross sorting tables)
- Display complementary files to the understanding of the results (web page, PDF appendices).
Context :
For this demonstration article, we will place ourselves in the simple case of a user wishing to create a configuration allowing the entry of answers, the visualization of the data table as well as the consultation of the results (by restoring a dashboard and a word cloud).
The goal is to allow you to quickly create a basic configuration.
NOTE: WARNING It is strictly not recommended to edit two report configurations from the same internet browser (open on two tabs), this risks overwriting the parameters of one configuration with those of the other.
Prerequisites :
We created a survey with Sphinx iQ2: a study of Reblochon (french cheese) packaging. This survey includes a form and several dashboards. The survey was published on a SphinxOnline account. Data has already been collected.
Platform Configuration :
 Creation of the report
The Web Reporting platform is configurable from the 6th stage of SphinxOnline: The Reporting tab.
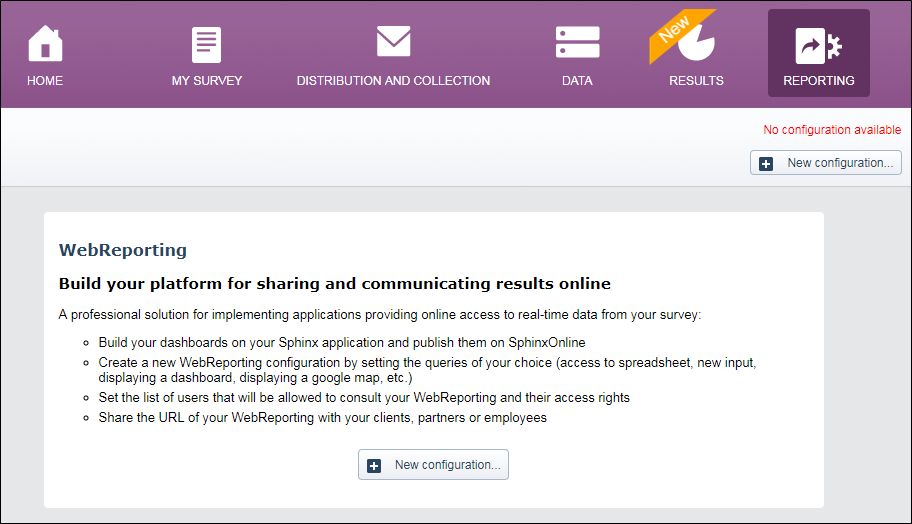
Then click New configuration.
A menu will suggest you choose a default restitution type. This is a pre-configured action that enables you to save time. Everything is changeable afterwards.
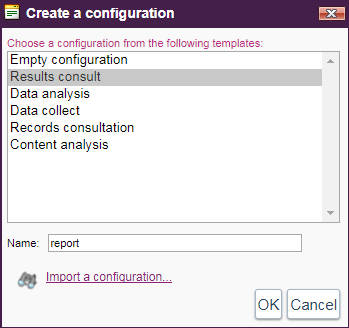
We will choose to start with an empty configuration.
Overview of the workspace
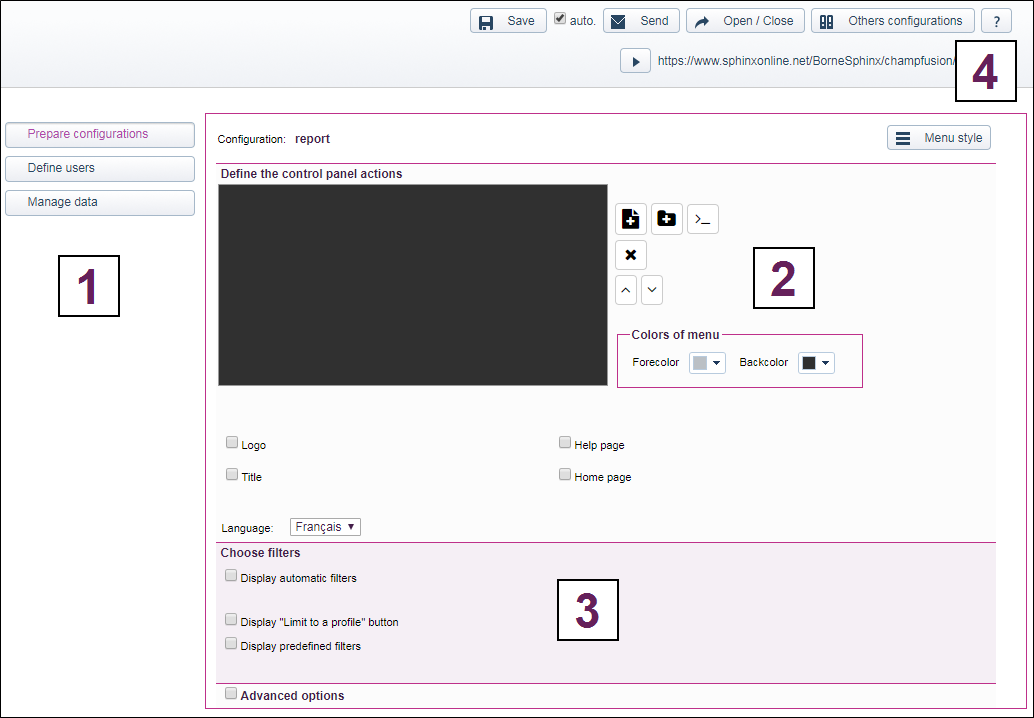
Features Details :

- Prepare configurations : The area where you can create and modify the contents of a configuration.
- Define users : A zone for creating and modifying the list of people allowed to view the defined online reports.
- Manage data : An area where you can create and modify the list of data management actions to be performed before accessing an online report, allowing you to manage the list of additional files associated with the survey.
 Functionality allowing you to add and organize actions in the platform
 Functionality for managing platform-specific options (which will apply to all defined actions).
 Functionality allowing you to restrict the opening, to create other configurations and to diffuse: presence of the access url to the platform.
Adding an action
To add an action, click on the button : 
An action list is then suggested. They are classified into the following five broad categories :
- Collect
- View the tables
- View the results
- Display a page
- Other actions
The settings window for an action appears as follows :
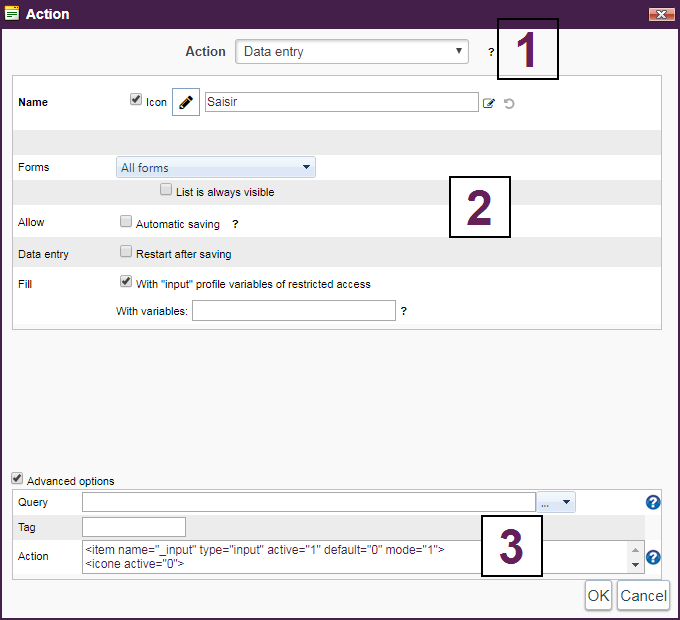
: Drop-down menu to choose the desired action.
: Zone allowing the parameterization of the various options related to the chosen action. These options are different if you want to perform an action of data entry, results or a consultation, for example.
: Zone allowing "advanced options" by adding queries and code. PS: We will not discuss this part in detail in this article.
Below is a list of possible actions :
Adding a data entry action
In our example, we will create a first data entry action, which we will name Enter a questionnaire.
Since it is possible to create multiple forms with Sphinx iQ2, a drop-down menu allows you to associate a particular form with the action.
NOTE: By choosing All forms, a drop-down menu will be associated with the action and will allow the user to choose the form directly from the platform.
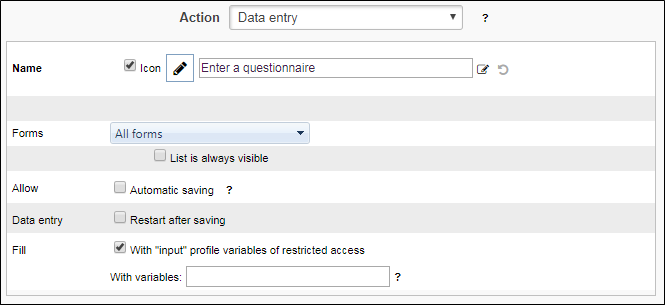
We'll leave the other options as they are and then we will validate the setting.
We have just created the first action of our platform :
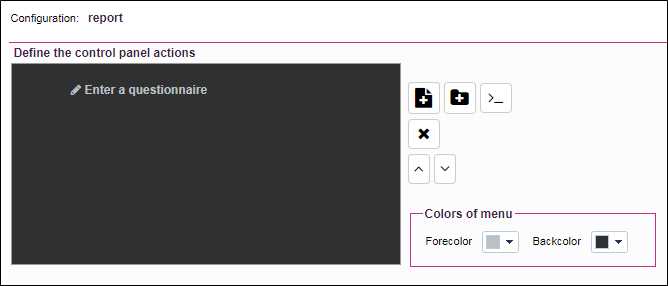
Adding a Data Table View action
Second step: We now wish to give the user the possibility of consulting the raw observations table.
To do this, we will create an Observations table action that you will find in the view the tables group.
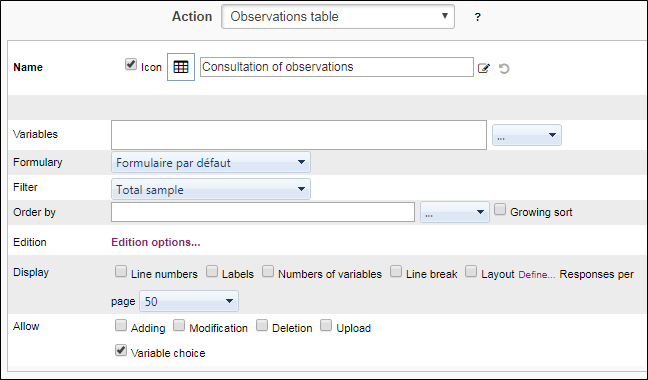
We name this action Consultation of observations :
The Variables field allows you to select the variables of the survey you want to display. If nothing is filled, then all the survey variables will be displayed.
From the Allow group, you can allow, or not, various actions on the data table: Add / modify / delete observations, upload or select the variables to display.
The modification can be done either directly in the spreadsheet or by accessing the observation via a form. In the case of the second option, you can define the modification form via the formulary drop-down menu.
Various display options are available: line numbers, labels, variable numbers ...
By default, the spreadsheet is sorted according to the entry date of the observation. By using the Order by option it is possible to define the sorting on one or more variables.
Adding a results viewing action
We will now add an action to view the results. To do this, we will create a Report action that you will find in the View the results group.
We will name our action Reblochon perception results .
The survey has several Reports, therefore you must use the Reports pull-down menu to choose the correct one (here Reblochon Perception)
It is possible to filter the results by choosing a stratum previously defined in Sphinx iQ2.
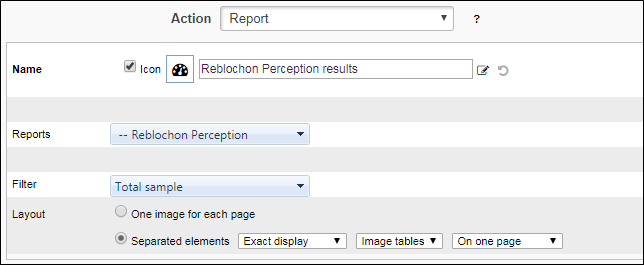
Adding a word cloud display action
There are several text variables in our survey, one of which is the respondent's justification for choosing a wall of image.
For a more synthetic view of this type of variable, Sphinx proposes a restitution in the form of word cloud.
To do this, we will create a Word cloud action that you will find in the View the results group.
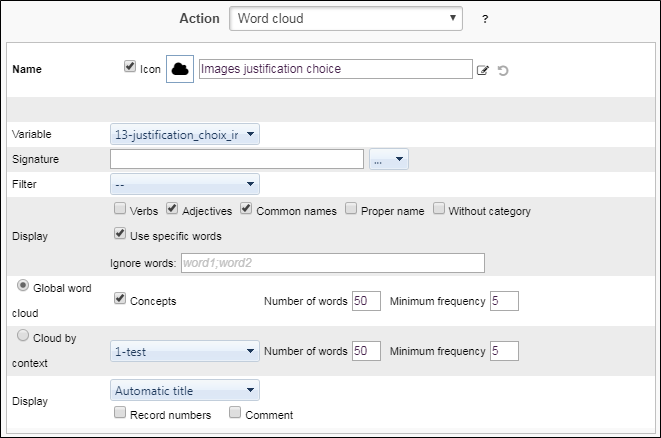
We name this action images justification choice :
- The Variable field allows you to select the text variable.
- You can choose a signature variable as well as a filter variable.
- You also have the ability to restrict the words that will be displayed in the word cloud (depending on their grammatical category).
- You can choose to display either the global cloud or the context clouds (ie you will have a word cloud for each modality of the chosen context variable).
Add filters
In an online report, it is possible to obtain results after applying filters. These filters can come from:
-
The use of a period filter
-
The use of automatic filters
-
The use of predefined filters in the survey (data section)
-
The use of a custom filter
-
The use of a filter action from the command toolbar
-
A data profile in restricted access
Below we explain how to select and configure the filters that will be available at runtime, using the configuration editor.
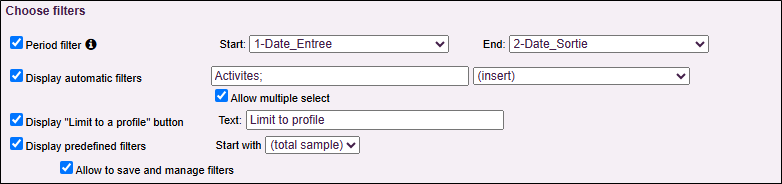
Display a period filter
This filter allows filtering the online report results based on a custom time period.
EXAMPLE: As a campground manager, view results from Saturday to Saturday for the month of July, then from Saturday to Saturday for the following week, or display results for a specific weekend.
-
Check the Period filter option.
-
Select a date-type variable from the Start menu.
-
Select a date-type variable from the End menu.

It is possible to select the same variable for both start and end dates.
NOTE: Only date-type variables in the format DD/MM/YYYY can be selected.
The period filter appears above automatic filters and allows results to be filtered based on a specific date range.
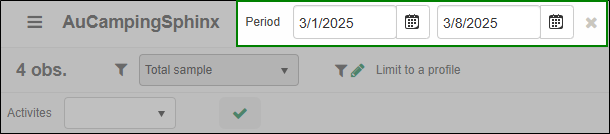
Display automatic filters
Checking Display automatic filters means that at runtime, the user will have direct access to automatic filters defined in the text area.
These filters can be defined using variable numbers, a variable range like "3-6", or directly with the variable name "brand", separated by semicolons or selected through the dropdown menu listing available variables.
Display the "Limit to profile" button
Checking Display "Limit to profile" button allows users at runtime to access custom filter creation and change automatic filters.
The text defines the label of the link that gives access to managing custom and automatic filters. If automatic filters are selected but the "Limit to profile" button is not enabled, the report user will not be able to modify the automatic filters.
Display predefined filters
Checking Display predefined filters means that the user will have access to predefined strata at runtime.
It is possible to choose which stratum the online report loads by default by selecting one from the Start with list.
By allowing users to choose their automatic and/or custom filters, you can also allow them to save custom filters for reuse.
To do this, check the last option Allow to save and manage filters. At runtime, by clicking Limit to profile, users can add their custom filter to the saved filters.
Finalization of the platform
Once validated, here is the rendering of the four actions previously set.
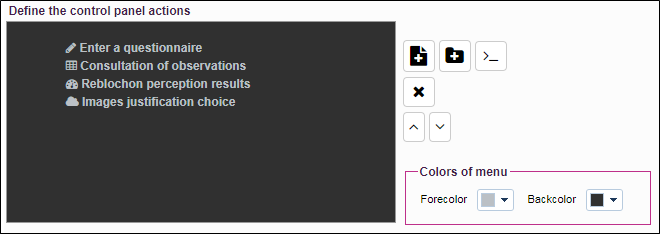
You have tools to finalize the presentation of the sideband that will display the actions.
It is possible to customize the sideband colors as well as texts.
It is also possible to create action groups by clicking on 
For example, we have created a Results group in which we put the two actions (Reblochon perception results and Images justification choice). This is done by drag & drop by selecting an action and dragging it over the created title.
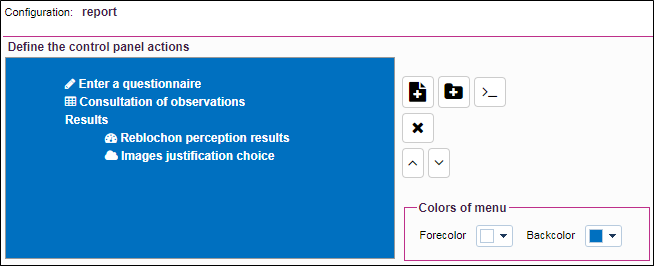
Platform rendering
All we have to do now is to test the platform we have just created.
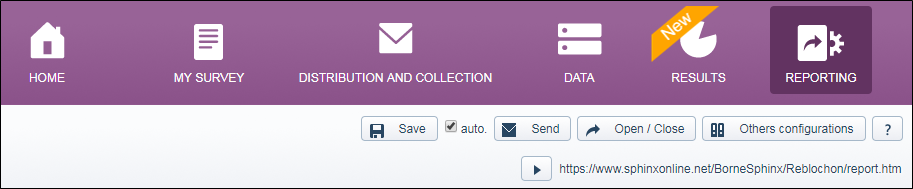
To do this, simply launch the link to the Web Reporting that you can find in the upper band.
Here is the rendering when launched on a browser.
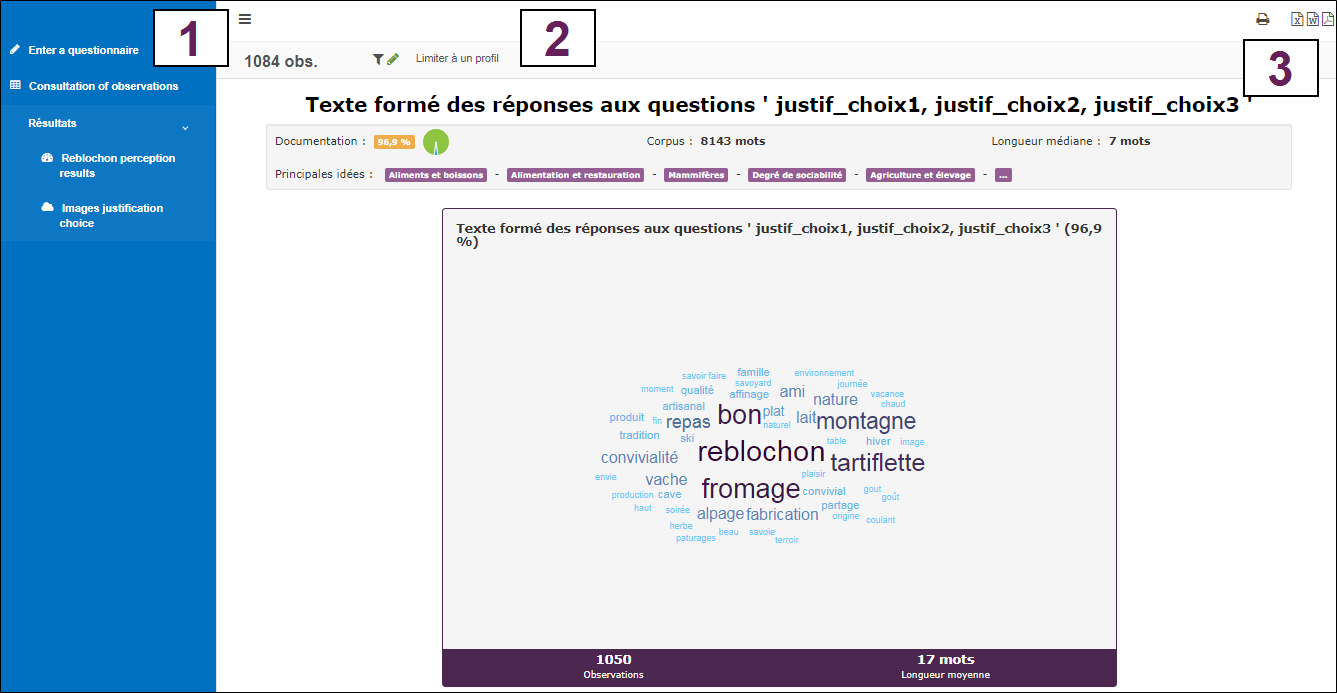
: Side menu for selecting the action.
: Function to limit the analyzed observations according to a profile defined by the user.
: Icons for exporting (PDF, Word, Excel depending on the type of displayed action) and printing.
Define users
The Define users tab allows you to configure and enable restricted access. This restriction is valid for all created configurations (unless Ignore restricted access for the current configuration is checked in the Security management of advanced options of a configuration). The purpose of restricted access is to compartmentalize access priori filtering results.
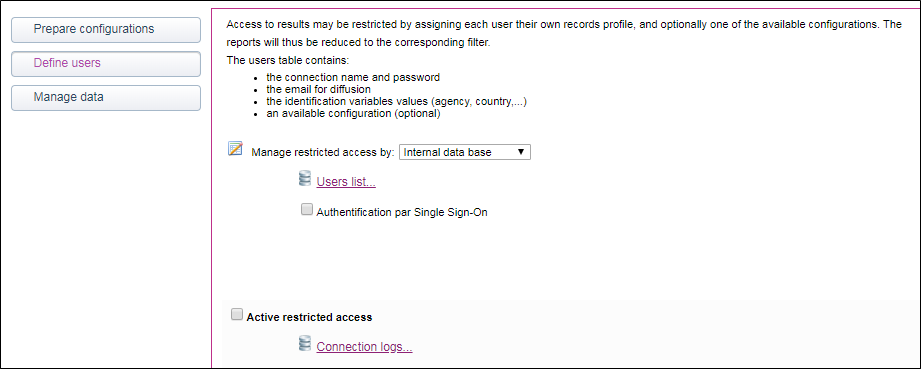
Enable restricted access
Check Enable restricted access and click on Save.
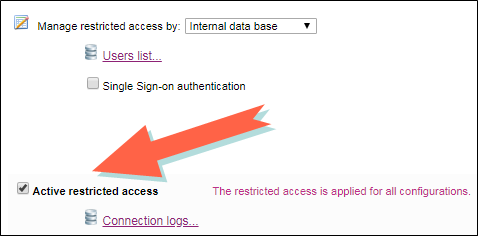
A username / password will be asked to log into the report.
Add and edit users
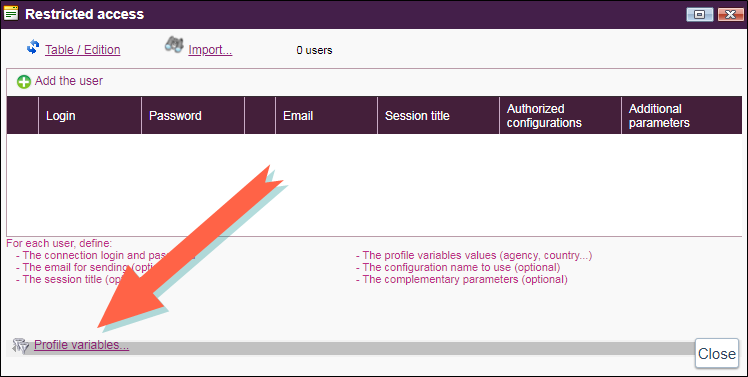
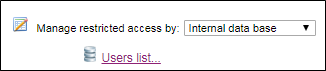
Click on Users List ... to configure restricted access by adding users and choosing the profile variables to be used.
Restricted Access via Sphinx Authentication
This type of authentication allows you to simply add users by entering their email address (and other additional elements if necessary). They will later be contacted by email to set their access password / to access the report.
Add a User
-
Select Sphinx Authentication from the dropdown menu Manage restricted access by.
NOTE: Check the Multi-survey profiles box for relevant surveys to allow users to access the web reports of those surveys. This is a convenient option, as it avoids having to manually specify the user list for each report.
-
Click on Users list....

-
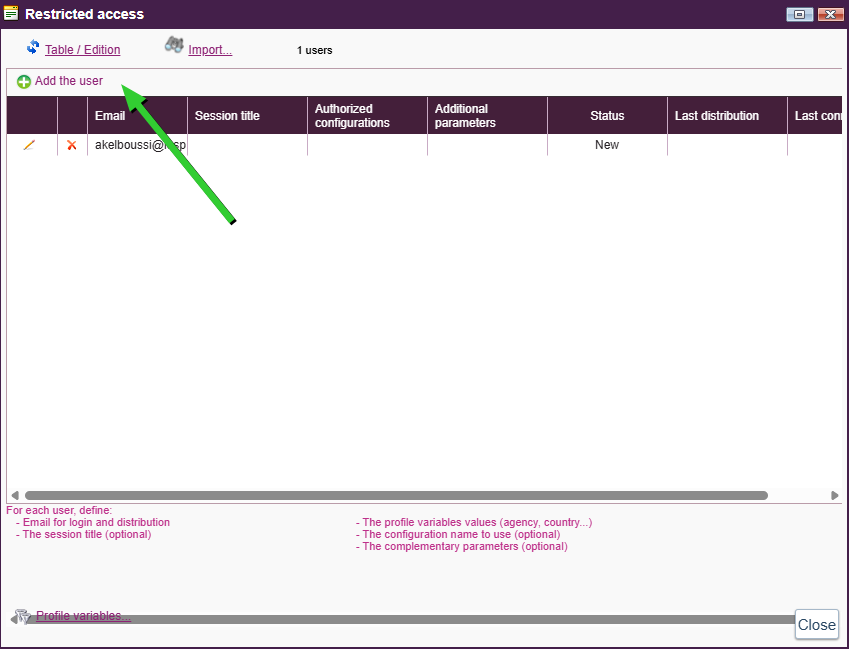
Click on Add the user.
-
Add users by entering the following elements:
Mandatory:
-
User's email address.
Optional:
-
Session title: specify a label for each user (e.g., "Branch Director").
-
Authorized configurations: define which configurations can be viewed by the user (names must be separated by semicolons ";").
-
Additional parameters: specify special options (e.g., define actions accessible to the user).
NOTE: You can import users from a CSV file by clicking "Import...". The file must contain a column named "Email".
-
-
Click on Close.
Edit a User
-
From the users list:
-
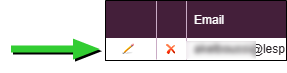
Click on the pencil icon next to the user to edit.
-
Make the necessary changes.
-
Click on
 to save the changes.
-
Delete a User
-
From the users list:
-
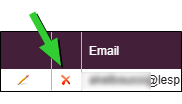
Click on the cross icon to delete the relevant user.
-
Click on OK to confirm deletion.
-
-
Assign Profiles
Assigning profiles to users helps restrict data display or result access based on their role.
EXAMPLE: In a satisfaction survey for a bank, each branch manager should only view results for their branch. You must use a variable that identifies which observation belongs to which branch.
To do so:
-
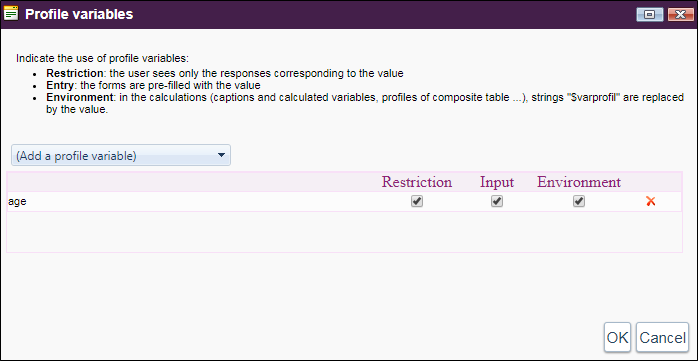
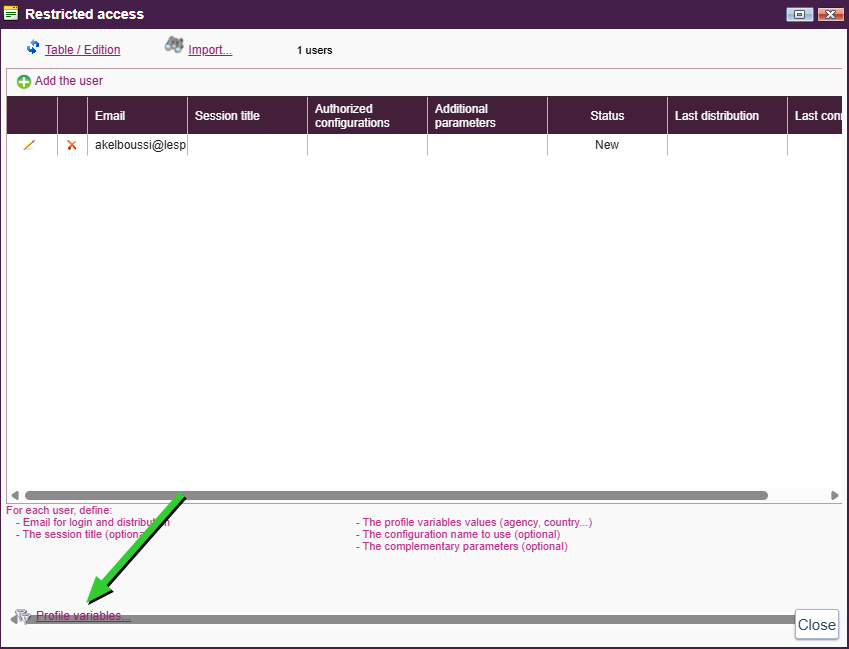
From the restricted access users list, click on Profile Variables....
-
Select the variable(s) to use from the dropdown menu.
-
Check the Restriction option (user will only see responses matching the value).
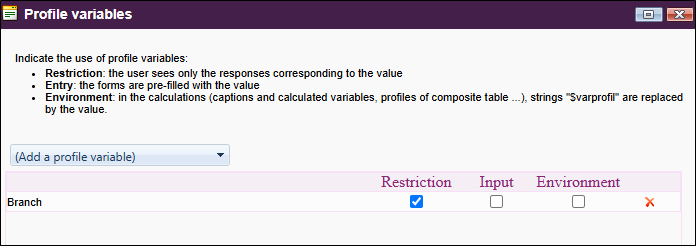
The Input or Entry option pre-fills forms with the value you determine. This is useful if you need to identify who did which observation for example.
-
Click on OK to confirm.
The selected variable will appear in the users list.
-
Enter the matching value for each user for the selected variable (by using the pencil icon).
EXAMPLE: The first user will only see results from the Annecy branch, the second user will only see results from the Paris branch, and the last one will see all results since no value was specified for the "Branch" variable.
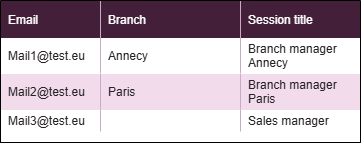
NOTE: The profile variable value must exactly match the modality in the questionnaire (same spelling).
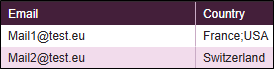
NOTE: To enter multiple values or modality numbers in a profile variable, separate them with semicolons.
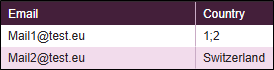
NOTE: For multilingual surveys, you must specify the modality number as the value instead of its label.
Distribute the report
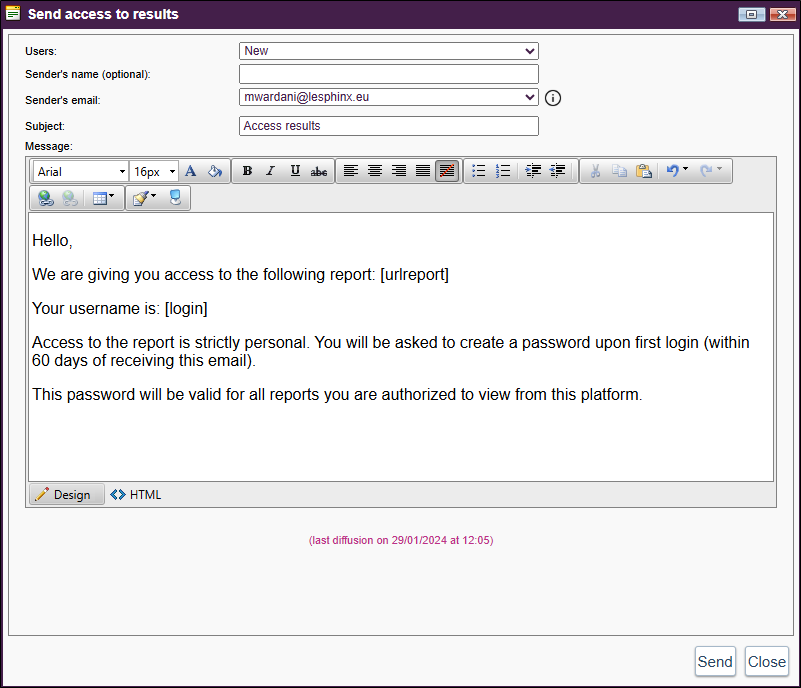
You can distribute the report based on the recipient's status by sending the invitation to new recipients, contacted recipients, active users, or simply to all recipients.
-
Click on the Send button below the purple banner.
-
Select the status of recipients to contact ("New" is selected by default):
-
New: recipient has never been contacted.
-
Contacted: recipient received at least one invitation but never logged in.
-
Active: recipient logged in at least once.
-
All: sends the report to all recipients, regardless of status.
Custom selection...: allows filtering recipients by email or status.
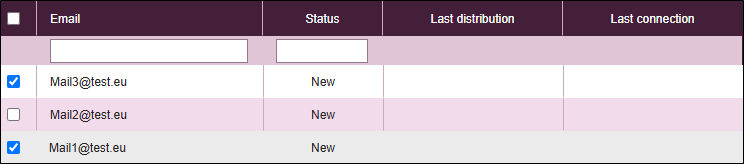
-
-
Enter sender's name (optional), their email address, and the subject of the email.
-
Customize the message content.
NOTE: Fields [urlreport] and [login] must be included in the message
-
Click on Send.
The user will be asked to create a password upon first login (within 60 days of receiving the email).
This password will be valid for all reports the user is authorized to view on this platform.
NOTE: Logins are shared across the server. If an existing user is invited to another report on the same or a different project, they can log in with their existing credentials.
Internal restricted access to the application
It is possible to configure all users through a spreadsheet or text interface (click Table / Edition to switch from one to another).
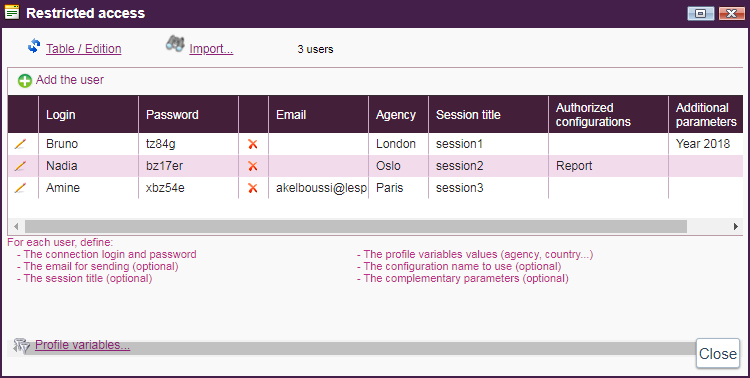
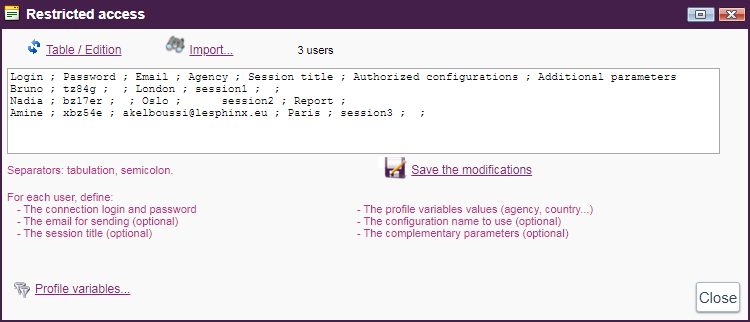
- In this example 3 users are defined. The restriction is relative to the variable Agency.
- The Session title column allows you to customize the titles of actions or filters.
- The Authorized configuration column allows you to choose the online report visible to the user. If a configuration is chosen, regardless of the link with which this user will query Web-reporting it will be redirected to the defined online report.
- The Additional parameters column allows you to set specific options. For example, in the example above, the online report for Bruno initializes on predefined filter Year 2018, regardless of what is defined in the configuration on the Prepare Configurations tab, in the Start With list.
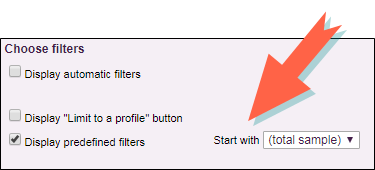
However, if the filter chosen in the restricted access is not a visible filter, this constraint will not be held. If Display predefined filters has not been checked on the Prepare Configurations tab, indicating a "start with" filter still works. The answers accessible to this user will be restricted to the chosen filter. The user will not be able to change filters.
Restricted access in a Sphinx survey
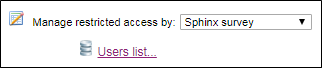
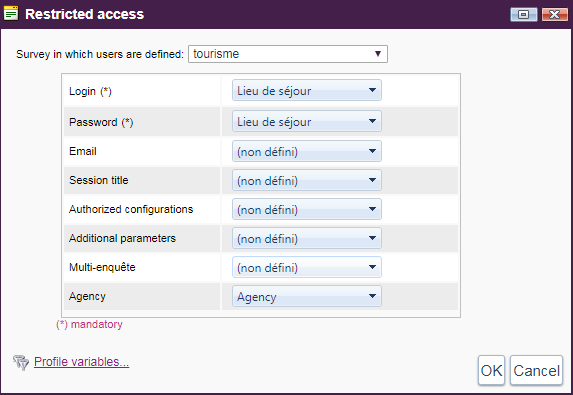
- Choose Sphinx survey from the drop-down menu.
- Clicking Users List ... allows you to configure how the variables in the Sphinx survey should be read.
To use Single Sign-On Authentication, please refer to the following document: Authentication SSO
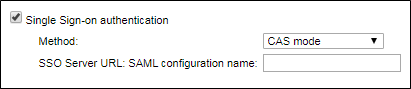
NOTE: Single Sign-On (SSO) authentication is only available on dedicated servers
Customize the login page
There are two login page templates: Classic and Modern.
In the case of a modern login page, it is possible to edit the background image and insert a title.
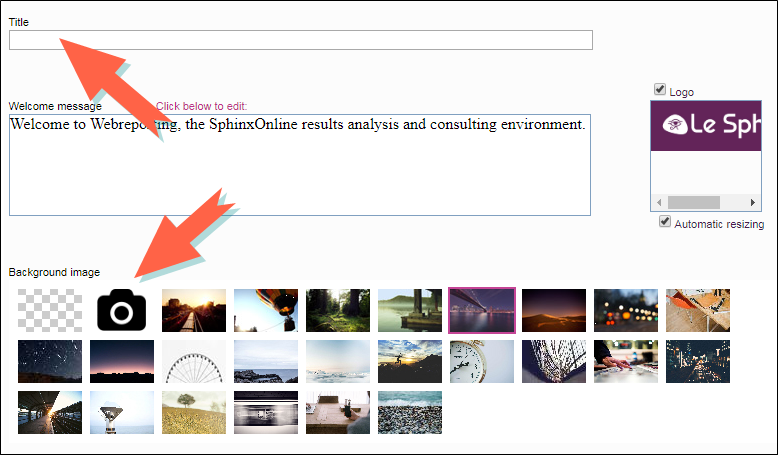
The Welcome Message text box allows you to customize the login screen presented each time you connect to the online report.
Check Logo displays a box in which appears the logo chosen for the login screen. To add or modify the chosen logo, click in the zone delimited under Logo. The image choice editor appears.
Use restricted access
In our example, after configuring restricted access and having it activated, the online report opens on the following screen:
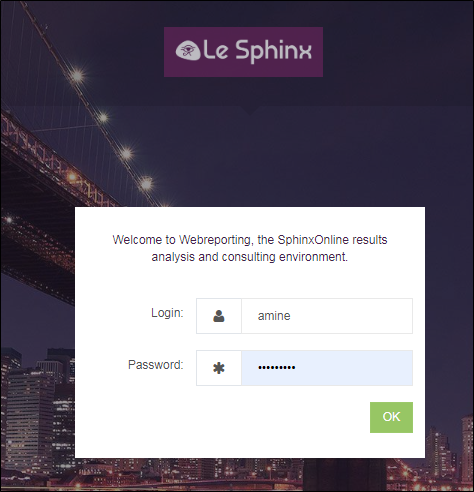
Modern login page
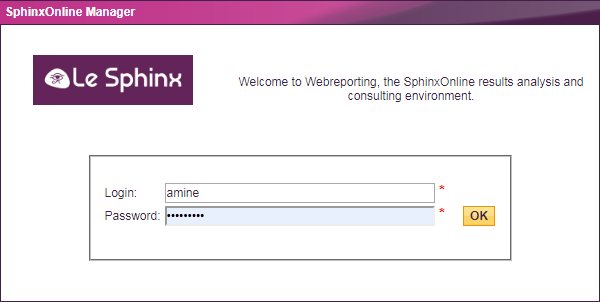
Classic login page
Manage data
Clicking the Manage Data tab provides access to data refresh and management of additional files.
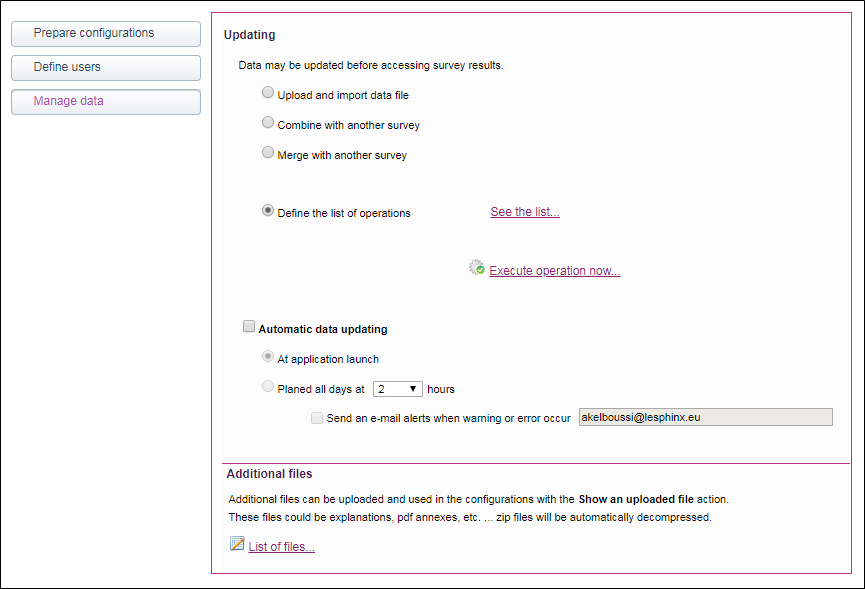
Update data
Access to the results of a survey may be preceded by an update of the data.
Clicking on see the list opens the following window:
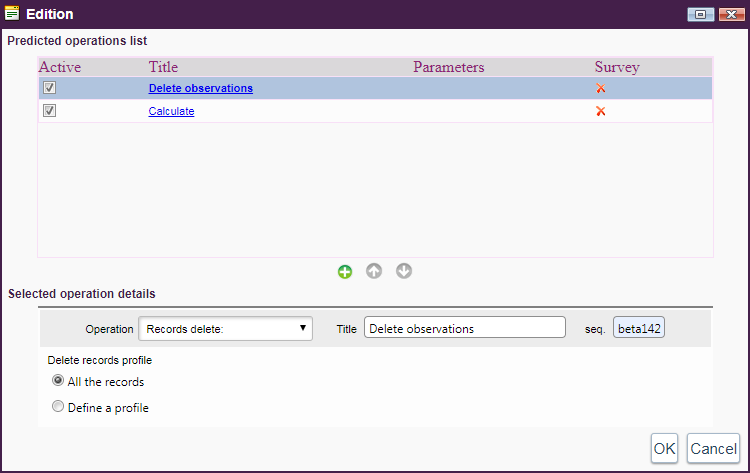
A first list of actions to perform. In this example, we suppose we want to delete the observations and then calculate the variables.
- Clicking Execute operation now opens the following window :
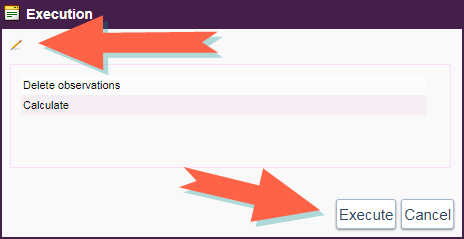
- To edit the operations, click on the pencil at the top left of the window.
- Click Execute to start operations. Execution stops if an error occurs during an operation.
Manage additional files
Additional files can be uploaded and used in the actions of an online report to present for example a help page or an annex.
Clicking on the list of files... opens the following window:
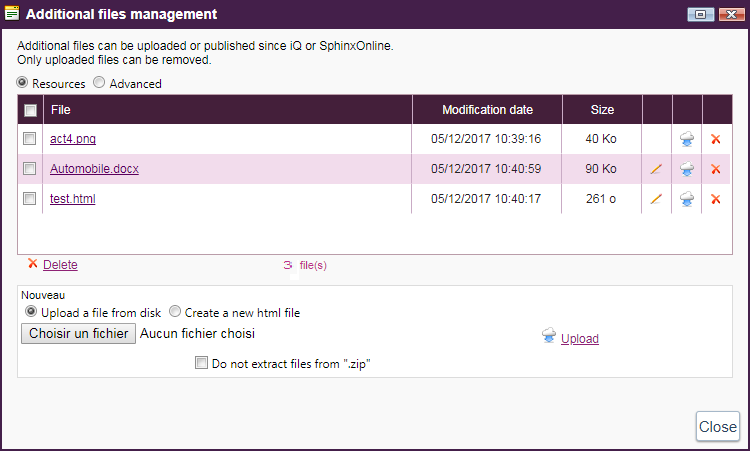
- To add a file, click Choose File, select a file on the hard disk and click Upload.
It is possible to create a file directly on the server:
- To do this, click Create new html file. Enter a name in the text box and click Create.
NOTE: Warning, for security reasons, any addition or modification of HTML file will remove Javascript and iframes in the HTML code of the file. Please contact support for more information.
The table shows all the files that have already been uploaded. Clicking on the name of a file starts downloading this file. Clicking Delete deletes the selected file from the server. For html pages, it is possible to edit the file online by clicking on the pencil.