Release Notes 5.2.12 (OCTOBER 2026)
General
-
AI token usage monitoring: AI token usage information is now available from the user menu.
-
Personal, centralized image library: Save, search, organize, and reuse account images from a personal gallery available in analysis views and the email editor.
-
New automated alert template: A modernized, multilingual default email template is now available, along with improved code formatting in the editor.

Data
-
Create and manage data connectors: Create and modify Partoo connectors or code file generation connectors from a dedicated interface.
-
Google review collection: A new Google Reviews connector automatically retrieves an establishment's latest reviews in a Sphinx survey, including ratings, comments, authors, dates, and associated responses.
-
Automated personal data cleanup: A new interface makes it possible to create and manage multiple GDPR cleanup rules for each survey. These rules can be run manually or automatically when a request to lift anonymity is declined or when a retention period expires, including for responses that have already been recorded. Rules are retained when projects are duplicated, backed up, or restored, and detailed processing logs are available.
Analysis
-
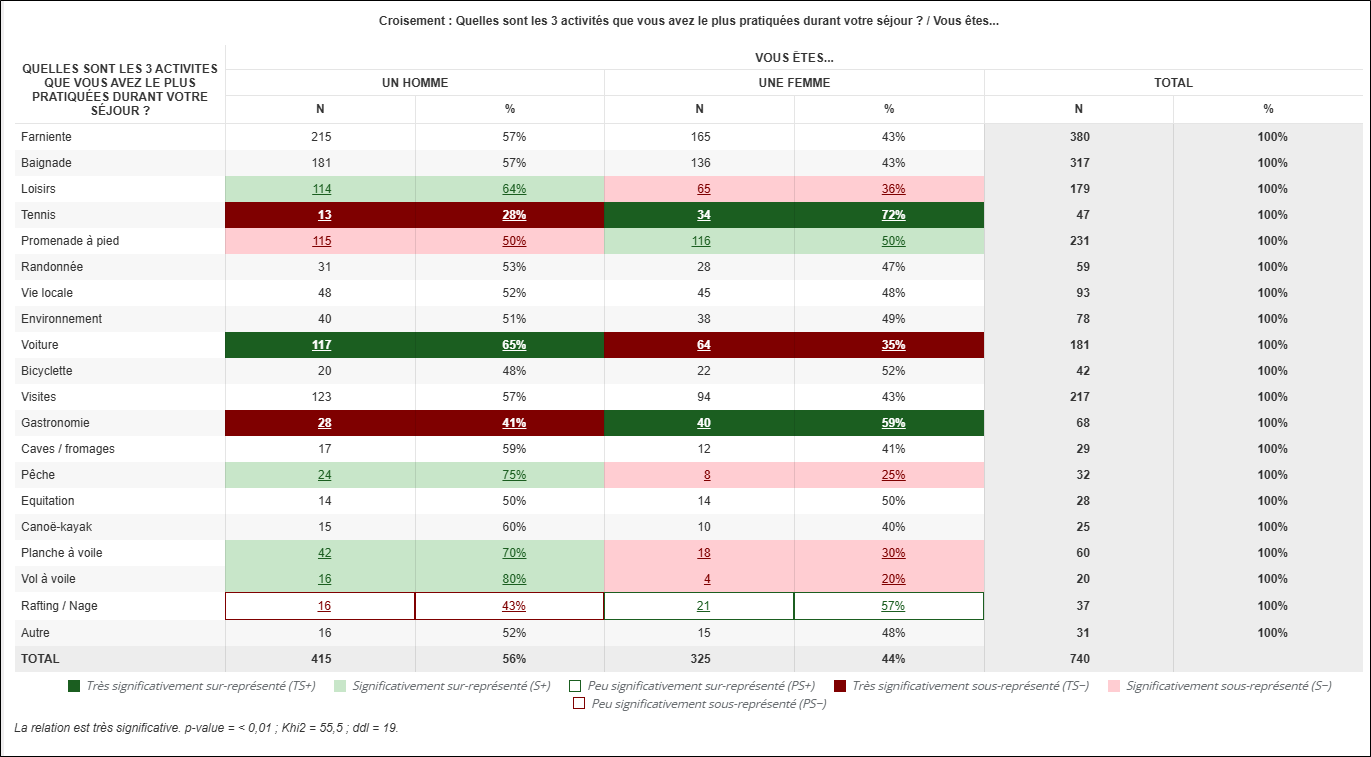
Cross-tab generator for Excel: Generate a view containing cross-tabs in a format that can be used directly in Excel, with selection of the cross variable and support for analysis options.
-
Variable selection in table generators: Select precisely which variables to include in frequency tables, cross-tabs, and tabulation books, with options to select all variables or select them by questionnaire section.
-
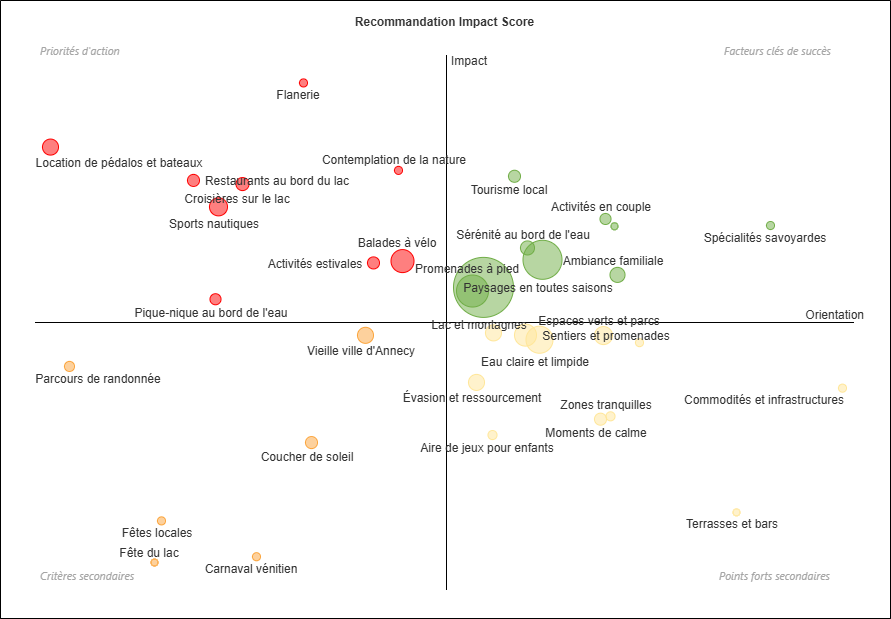
New Recommendation Impact Score matrix: Create an analysis that cross-references themes identified through coding with a satisfaction score to identify priority drivers. Themes can be filtered by a minimum response count, and shared orientations can be adjusted using a satisfaction scale.
-
Ability to add header rows, title rows, and merge cells in a custom table.
-
Detailed display of significance levels: A new display style distinguishes highly significant, significant, and less significant results while preserving the direction of differences and their presentation in exports.
-
Global statistical test display settings: Define in the view properties whether statistical tests are displayed by default in cross-tabs while preserving the custom settings of each analysis.
-
Category subtotals: Add a summary row or column for each category in compatible tables to make groupings easier to read.
-
Customizable filter width: Adjust the width of drop-down lists in view filters to improve the readability of long labels.
Administration
-
Automated account management: A secure administration API using personal access tokens is now available to view, create, and manage accounts, users, and credits according to the administrator's access level.