Data set quality
The Data set quality feature allows you to assess the completeness and documentation of the collected data. It is useful for ensuring the validity of upcoming analyses by identifying potential gaps in responses and variable structuring.
To access it:
-
Go to the Data section.
-
Click on Sample Quality.
Analysis content:
-
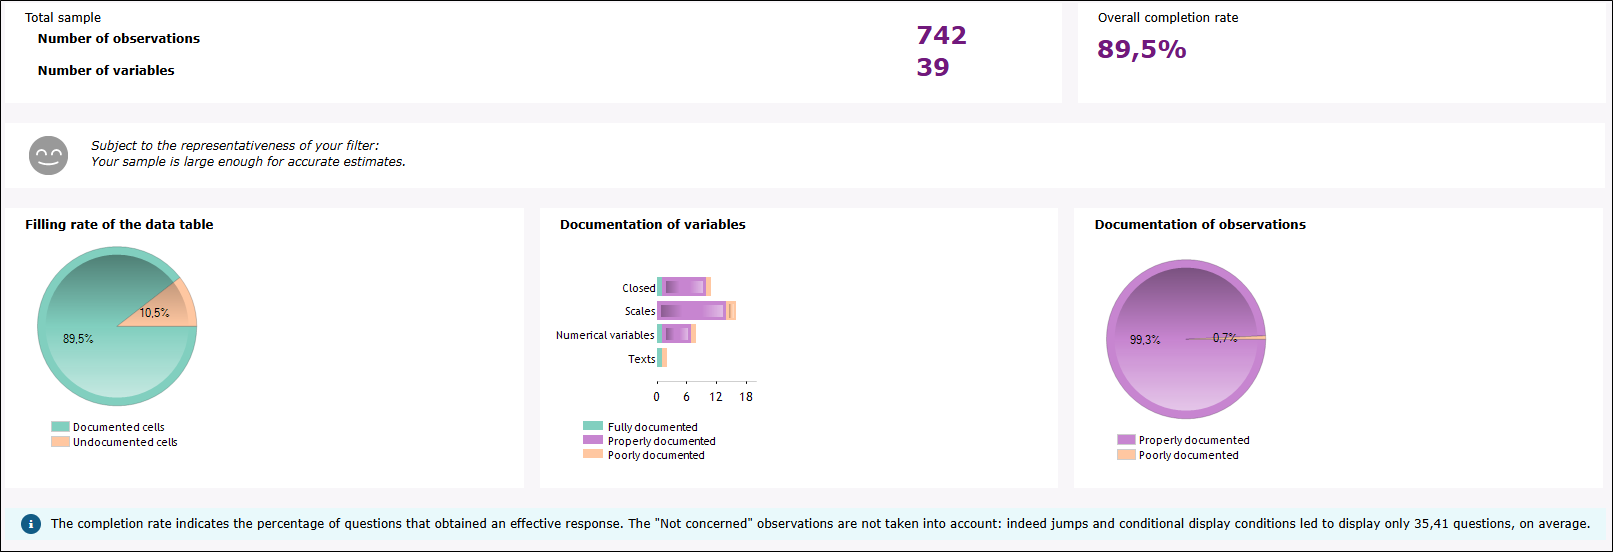
Number of observations: total number of survey responses.
-
Number of variables: total number of questions included in the dataset.
-
Overall completion rate: average percentage of valid responses to all questions.
An alert will notify you if the sample is insufficient for reliable estimates.
-
Completion rate of the data table: a pie chart shows the proportion of filled and unfilled cells.
-
Variable documentation:
Variables are classified by type (closed-ended, scales, numeric, text) and their level of completeness:
-
Fully documented: all cells are filled (100%).
-
Properly documented: more than 80% of cells are filled.
-
Poorly documented: less than 80% of cells are filled.
-
-
Observation documentation:
A pie chart evaluates the quality of each individual response across all variables.
-
Fully documented: 100% of variables are filled.
-
Properly documented: more than 80% of variables are filled.
-
Poorly documented: less than 80% of variables are filled.
-
-
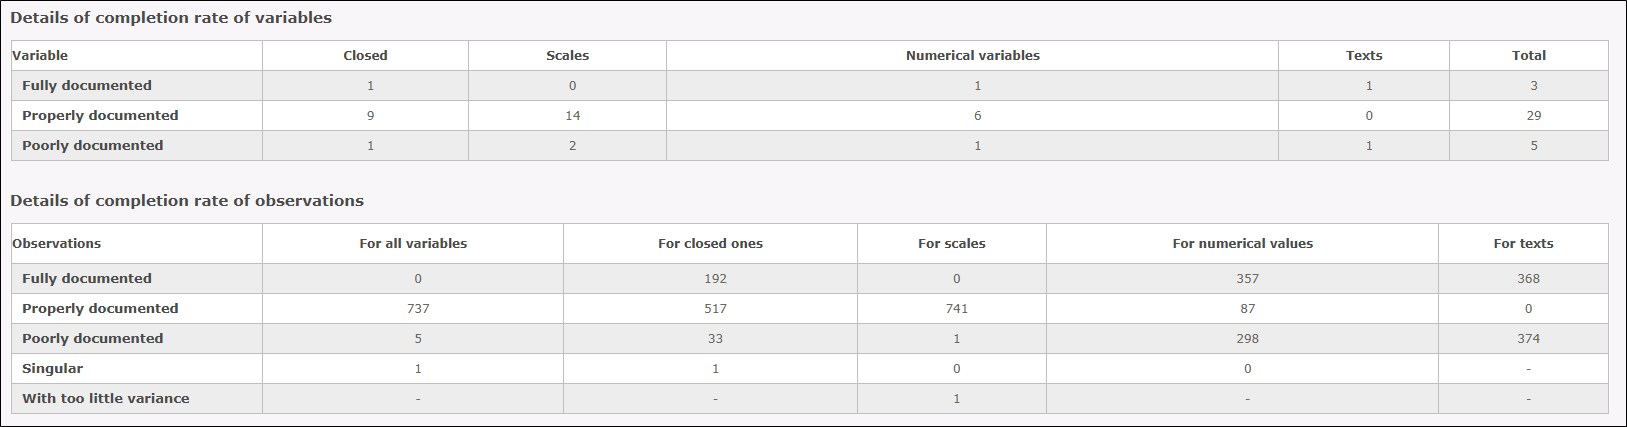
Detail of completion rates:
-
For variables:
A table details the number of well or poorly documented variables by type.
-
For observations:
A second table shows how many observations are well filled for each type of variable (closed-ended, scales, numeric, text), as well as those that are:
-
Singular (unique values).
-
With too little variance (lack of diversity in responses).
-
-
Apply a sample
It is possible to apply a sample to filter the dataset quality on a specific target. See the "Define a stratum" page for more information.
Print the dataset quality
Click the Print button to start printing the dataset quality assessment.